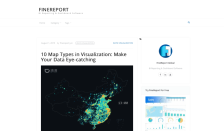
The words "geography" and "map" are commonly associated, largely because "map visualization is used to analyze and display the geographically related data and present it in the form of different map types." Readers interested in dabbling in data visualization and map making will enjoy this article, "10 Map Types in Visualization: Make Your Data Eye-catching," which covers some basic principles for...
The US Geological Survey (USGS) performs a wide variety of tasks related to the environment including data acquisition for use in geographical information systems. This data set provides elevation data for the contiguous US, Hawaii, and Alaska. Data are in one-by-one degree blocks and available via an online interface or by ftp download (instructions provided in the User Guide). Specific data can...
Provided by the Environmental Systems Research Institute (ESRI), the publishers of ARC/INFO GIS software, this site allows users to create a variety of maps online. ESRI has assembled both basemap data and thematic data sets, allowing users to create traditional geographic feature maps or thematic maps, such as income, crime, or population. Users may download selected GIS data sets as well as...
The Environmental Protection Agency (EPA)'s Enviromapper uses innovative Web technology to view and locate environmental information on "drinking water, toxic and air releases, hazardous waste, water discharge permits, and Superfund sites." Thumbnail US map images expand with a click to show facilities regulated by the EPA, information about local watersheds, and local national priority list...
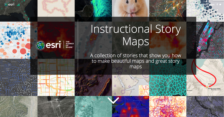
Maps can be beautiful, engaging, and informative ways to learn or educate about a topic, and story maps offer a way to add multimedia and narrative to the mix as well. But for the uninitiated, the prospect of creating a high-quality digital map may be daunting. Fortunately, the team at Esri has created a free resource to help. This collection of story maps is designed to instruct visitors on how...
Professor Andreas Spanias of Arizona State University has supervised the development of this online digital signal processing (DSP) system simulation utility. This utility has many functions that allow the user to generate various signals, create filters, and analyze the responses. Other functions include Fourier Transforms, convolution, autocorrelation, and several speech processing tools. The...
The Knight Digital Media Center produces a range of media tools designed to assist journalists and other storytellers with their work and projects. This site of tools is designed to help people get started with using maps in their various publications and presentations. The presentations here include "Map Mashup Resources", "Google Map Basics", "Embedding Map Mashups" and "Map Mashups:...
This new research report from the National Institute of Justice (NIJ) and the Crime Mapping Research Center (CMRC) (reviewed in the August 10, 1999 Scout Report for Social Sciences) offers a detailed introduction to the science of crime mapping. Rather than a practical guide to specific software, the report "presents a broad approach and addresses the kinds of questions crime mapping can answer...
To its detailed coverage of the United States, Mapquest has added maps for cities and regions around the world. The interactive atlas can now display international locations on six continents; maps are detailed to the highway and boulevard level. For US addresses, users may search for locations by street address and view a map of the neighborhood. Registration, free of charge, allows the user to...
The Silicon Valley Toxics Coalition (SVTC) works "to document and expose the hazards of the high-tech industry and to promote environmental and economic sustainability and accountability in the electronics industry, the fastest growing manufacturing sector in the world." To those ends, the SVTC Website offers three interactive Eco Maps showing Toxic Chemical Point Sources, Cumulative Exposure...